Cartesian Space DMP
In a Cartesian Space DMP, the rotation are represented by quaternions. A normal DMP cannot be used in this case because it requires that each component can be linearly interpolated on its own, which is not the case for three-dimensional orientations.
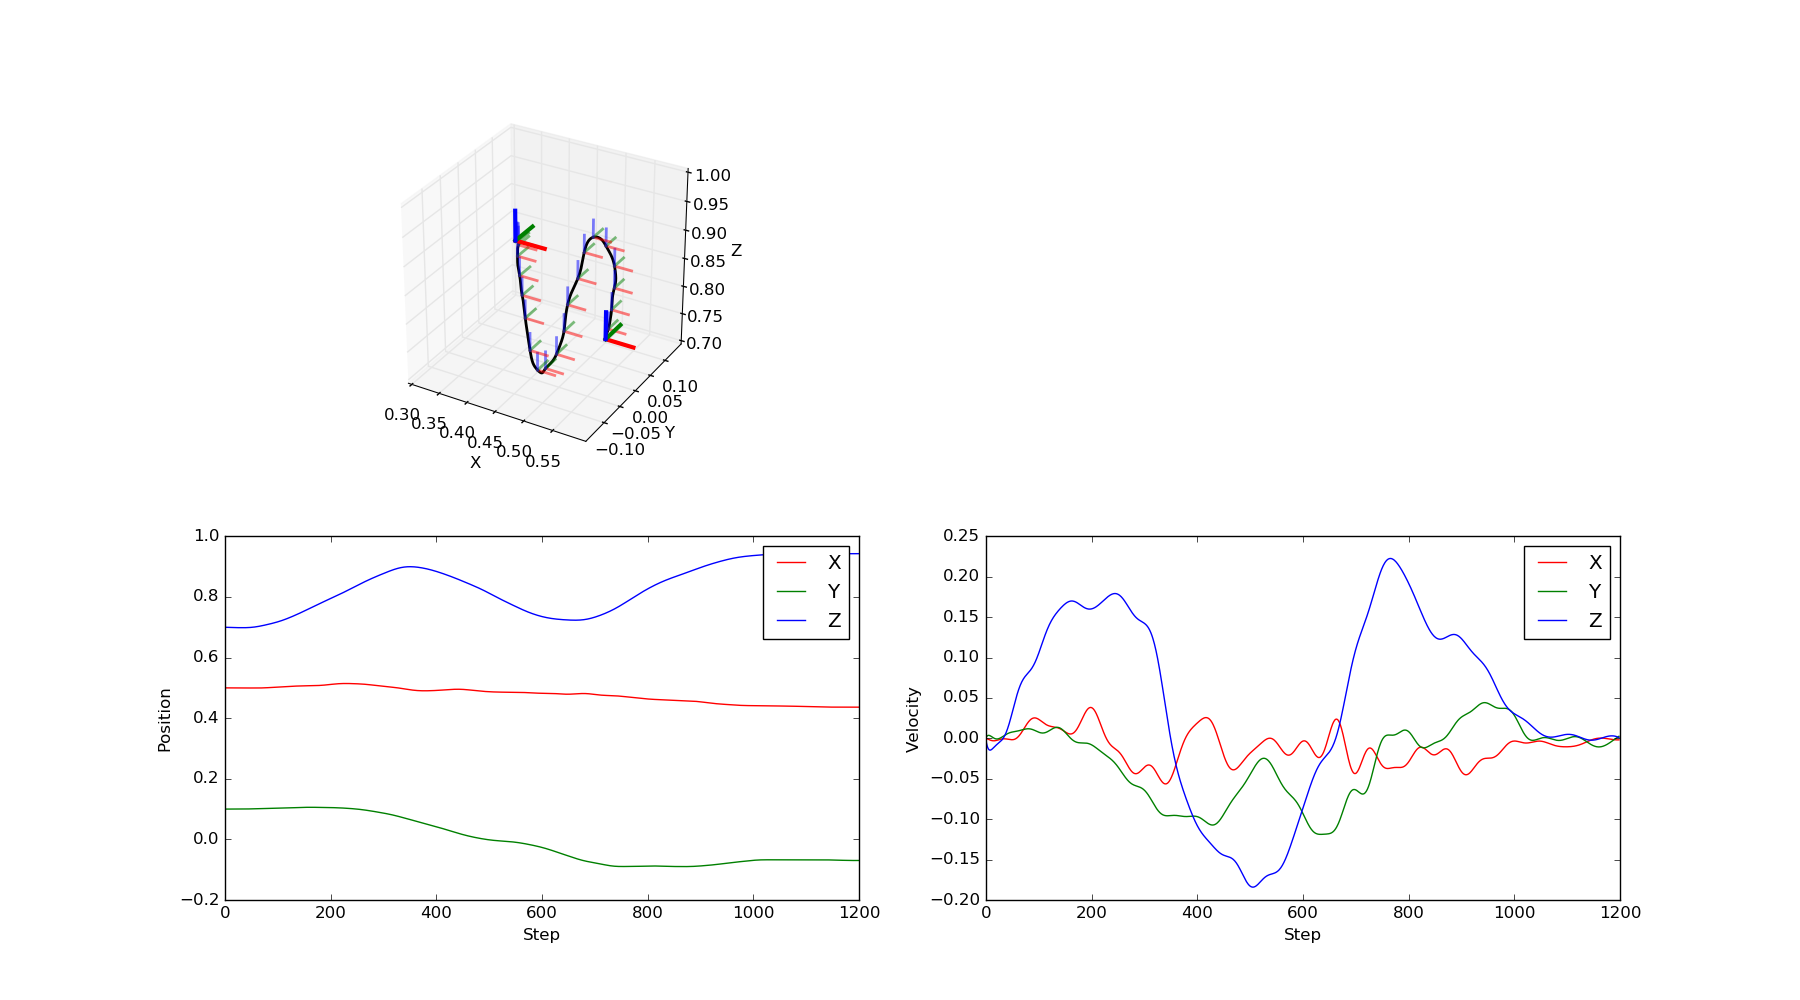
The following plot shows the trajectory generated by an imitated Cartesian Space DMP, start and goal positions, and orientations. Note that executing such a DMP on a robot requires an inverse kinematic that computes the required joint angles to reach the given poses. It is not guaranteed that a smooth trajectory in Cartesian space will result in a smooth trajectory in joint space.

print(__doc__)

import os
import numpy as np
import matplotlib.pyplot as plt
from mpl_toolkits.mplot3d import Axes3D
from bolero.representation import CartesianDMPBehavior


def matrix_from_quaternion(q):
    w, x, y, z = q
    x2 = 2.0 * x * x
    y2 = 2.0 * y * y
    z2 = 2.0 * z * z
    xy = 2.0 * x * y
    xz = 2.0 * x * z
    yz = 2.0 * y * z
    xw = 2.0 * x * w
    yw = 2.0 * y * w
    zw = 2.0 * z * w

    R = np.array([[1.0 - y2 - z2,       xy - zw,       xz + yw],
                  [      xy + zw, 1.0 - x2 - z2,       yz - xw],
                  [      xz - yw,       yz + xw, 1.0 - x2 - y2]])

    return R


def plot_pose(ax, x, s=1.0, **kwargs):
    p = x[:3]
    R = matrix_from_quaternion(x[3:])
    for d, c in enumerate(["r", "g", "b"]):
        ax.plot([p[0], p[0] + s * R[0, d]],
                [p[1], p[1] + s * R[1, d]],
                [p[2], p[2] + s * R[2, d]], color=c, **kwargs)

    return ax


def plot_trajectory(ax, X, color="k"):
    ax.plot(X[:, 0], X[:, 1], X[:, 2], lw=2, color=color)
    for x in X[50:-50:50]:
        plot_pose(ax, x, s=0.03, lw=2, alpha=0.5)
    plot_pose(ax, X[0], s=0.05, lw=3)
    plot_pose(ax, X[-1], s=0.05, lw=3)


try:
    dirname = os.path.dirname(os.path.realpath(__file__))
except NameError:
    dirname = "."
model = os.path.join(dirname, "cart_dmp_model.yaml")
config = os.path.join(dirname, "cart_dmp_config.yaml")

dmp = CartesianDMPBehavior(configuration_file=model)
dmp.init(7, 7)
dmp.load_config(config)

plt.figure(figsize=(18, 10))
ax = plt.subplot(221, projection="3d", aspect="equal")
plt.setp(ax, xlim=(0.3, 0.6), ylim=(-0.15, 0.15), zlim=(0.7, 1.0),
         xlabel="X", ylabel="Y", zlabel="Z")

X = dmp.trajectory()
plot_trajectory(ax, X, "k")
ax = plt.subplot(223)
ax.plot(X[:, 0], label="X", c="r")
ax.plot(X[:, 1], label="Y", c="g")
ax.plot(X[:, 2], label="Z", c="b")
ax.legend(loc="upper right")
plt.setp(ax, xlabel="Step", ylabel="Position")

ax = plt.subplot(224)
dt = dmp.dt
ax.plot(np.diff(X[:, 0]) / dt, label="X", c="r")
ax.plot(np.diff(X[:, 1]) / dt, label="Y", c="g")
ax.plot(np.diff(X[:, 2]) / dt, label="Z", c="b")
ax.legend(loc="upper right")
plt.setp(ax, xlabel="Step", ylabel="Velocity")

plt.show()
Total running time of the script: ( 0 minutes 0.320 seconds)
