
Contextual optimization algorithms optimize
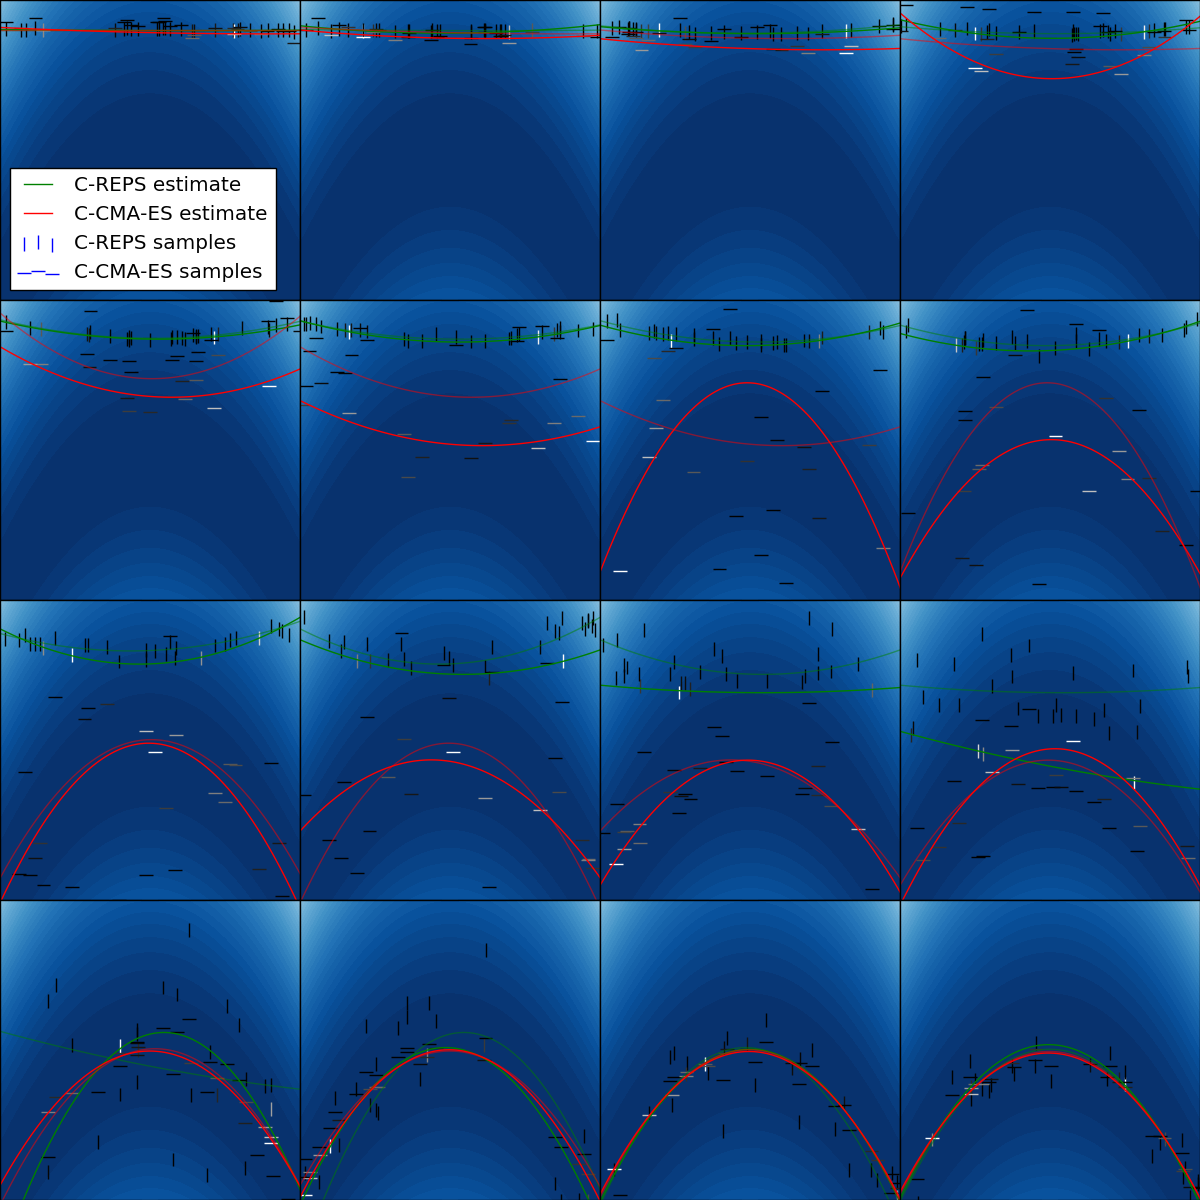
Conventual optimization algorithms optimize just a single scalar, contextual optimization optimizes a parametric function or conditional probability distribution. Two instances of contextual optimization algorithms are Contextual Relative Entropy Policy Search (C-REPS) and Contextual Covariance Matrix Adaptation Evolution Strategy (C-CMA-ES). Both use linear models with quadratic features and Gaussian exploration as a search distribution. Differences are in the update of the covariance matrix. In this example, we use a very simple objective function to illustrate samples from the search distribution and the current mean of the search distribution. Each sample is weighted based on the reward to update the search distribution. Weights are indicated by the color of displayed samples.
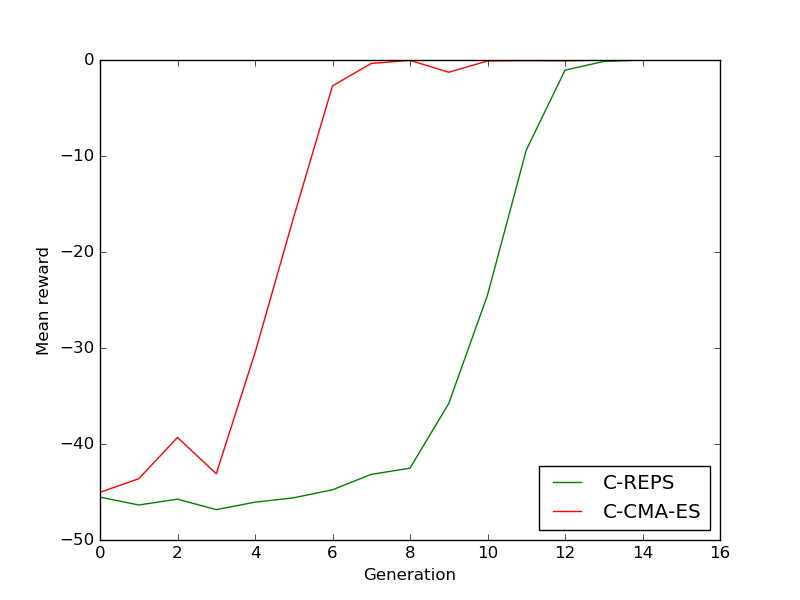
We initialize the search distribution with an intentionally low variance. C-CMA-ES adapts quite fast, C-REPS is slower because it bounds the Kullback-Leibler divergence between successive search distributions.
print(__doc__)

import numpy as np
import matplotlib.pyplot as plt
from matplotlib.patches import Ellipse
from bolero.optimizer import CCMAESOptimizer, CREPSOptimizer


def objective(x, s):
    x_offset = x + s.dot(np.array([[0.2]])).dot(s)
    return -np.array([x_offset.dot(x_offset)])


def plot_objective():
    contexts, params = np.meshgrid(np.arange(-6, 6, 0.1), np.arange(-6, 6, 0.1))
    rewards = np.array([[
        objective(np.array([params[i, j]]), np.array([contexts[i, j]]))[0]
        for i in range(contexts.shape[0])] for j in range(contexts.shape[1])])
    plt.contourf(params, contexts, rewards, cmap=plt.cm.Blues,
                 levels=np.linspace(rewards.min(), rewards.max(), 50))
    plt.setp(plt.gca(), xticks=(), yticks=(), xlim=(-5, 5), ylim=(-5, 5))


random_state = np.random.RandomState(0)
initial_params = 4.0 * np.ones(1)
n_samples_per_update = 30
variance = 0.03
context_features = "quadratic"
ccmaes = CCMAESOptimizer(
    initial_params=initial_params, n_samples_per_update=n_samples_per_update,
    variance=variance, context_features=context_features, random_state=0)
creps = CREPSOptimizer(
    initial_params=initial_params, n_samples_per_update=n_samples_per_update,
    train_freq=n_samples_per_update, variance=variance, epsilon=2.0,
    context_features=context_features, random_state=0)
opts = {"C-CMA-ES": ccmaes, "C-REPS": creps}
for opt in opts.values():
    opt.init(1, 1)
n_generations = 16
n_rows = 4

params = np.empty(1)
rewards = dict([(k, []) for k in opts.keys()])
test_contexts = np.arange(-6, 6, 0.1)
colors = {"C-CMA-ES": "r", "C-REPS": "g"}
plt.figure(figsize=(n_generations * 3 / n_rows, 3 * n_rows))
for it in range(n_generations):
    plt.subplot(n_rows, n_generations / n_rows, it + 1)
    plot_objective()

    contexts = random_state.rand(n_samples_per_update, 1) * 10.0 - 5.0
    for opt_name, opt in opts.items():
        last_policy = opt.best_policy()
        test_last_params = np.array([last_policy(np.array([s]), explore=False)
                                     for s in test_contexts])

        for i in range(n_samples_per_update):
            opt.set_context(contexts[i])
            opt.get_next_parameters(params)
            f = objective(params, contexts[i])
            opt.set_evaluation_feedback(f)

        policy = opt.best_policy()
        test_params = np.array([policy(np.array([s]), explore=False)
                                for s in test_contexts])
        mean_reward = np.mean(
            np.array([objective(p, np.array([s]))[0]
                      for p, s in zip(test_params, test_contexts)]))
        rewards[opt_name].append(mean_reward)
        plt.plot(test_contexts, test_last_params, alpha=0.5,
                 color=colors[opt_name])
        plt.plot(test_contexts, test_params, label=opt_name + " estimate",
                 color=colors[opt_name])

        weights = opt.weights
        if opt_name == "C-CMA-ES":
            marker = "_"
        else:
            marker = "|"
            weights = opt.weights / np.sum(opt.weights)
        plt.scatter(contexts.ravel(), np.array(opt.history_theta).ravel(),
                    c=weights, cmap=plt.cm.gray, marker=marker, s=100,
                    label=opt_name + " samples")
        if it == 0:
            plt.legend(loc="lower left")
plt.subplots_adjust(left=0, bottom=0, right=1, top=1, wspace=0, hspace=0)

plt.figure()
for opt_name, values in rewards.items():
    plt.plot(values, label=opt_name, color=colors[opt_name])
plt.legend(loc="lower right")
plt.xlabel("Generation")
plt.ylabel("Mean reward")
plt.show()
Total running time of the script: ( 0 minutes 6.362 seconds)